My GitHub profile was a terminal: a green contribution graph, an ASCII portrait in a dark window and a row of shields.io badges. It worked, but it looked nothing like avivashishta.com, which is paper, ink and three colours. So I redesigned it to match. It is live on github.com/AviVashishta29.
The short version: a GitHub README can't run JavaScript or load CSS, but it can show SVG images, and an SVG can carry its own CSS animations and embedded fonts. So every block is an animated SVG drawn by one Python script from my real contribution data, and a GitHub Action redraws them every morning.

Step 1: two directions on a design canvas
I asked Claude to read my current README and make something more impressive on a design canvas. It came back with two full mockups, drawn inside a GitHub-style frame so I could judge them in place:
- Three Worlds. Matched to my site: paper cards, Instrument Serif, and one tile each for BUILD (blue), BRAND (red) and LEARN (yellow).
- Avi OS. My terminal look pushed further: a boot log, an
htoppanel with my streak as "uptime" and an F1 to F4 key bar for links.
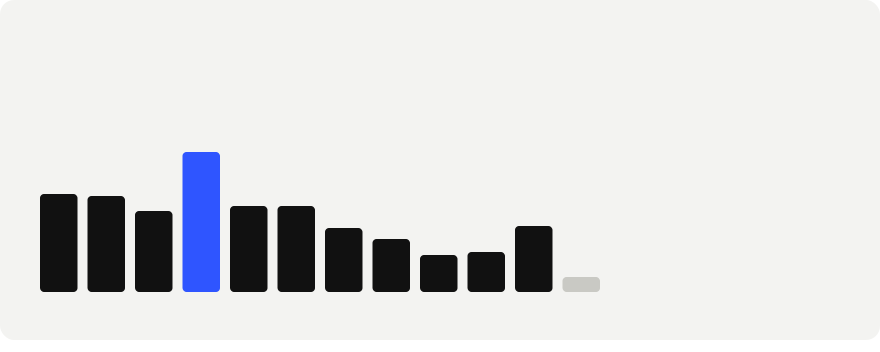
I picked Three Worlds, and then asked for a few changes. First, fewer pixels: the first version had a strip of pixels along the hero and a 366-square heatmap in the middle, and it felt busy. The heatmap became a bar per month, with the best month in blue. Second, more animation, and the blue contribution graph back. Then I rearranged it so the graph sits right under my face, the monthly bars under that, the colourful tiles after, and what I'm coding last.


Step 2: what a README is allowed to do
GitHub strips scripts, styles and most attributes from README HTML. What survives is <img>, <a>, <picture>, width and align. So the layout lives in the markdown and everything visual lives inside the images:
<a href="https://www.avivashishta.com/projects"><img src="./cards/build.svg" width="32.5%" /></a>
<a href="https://www.avivashishta.com/brands"><img src="./cards/brand.svg" width="32.5%" /></a>
<a href="https://www.avivashishta.com/blog"><img src="./cards/learn.svg" width="32.5%" /></a>
Three images at 32.5% each sit in a row with a small gap, and each one is its own link. An SVG shown through <img> is sandboxed: no scripts, no external requests. But its own <style> block runs, so CSS keyframes work, and so does SMIL (<animate>).
Step 3: fonts inside the image
An SVG in an <img> can't load Google Fonts, so I subset each font to printable ASCII plus a few arrows with pyftsubset and embed it as a data URI. Instrument Serif comes out around 18 KB, Geist under 10 KB:
b64 = base64.b64encode(open("fonts/serif-400.woff", "rb").read()).decode()
css = f"@font-face{{font-family:'Instrument Serif';src:url(data:font/woff;base64,{b64})}}"
One thing that cost me a render: the file Google served first for Instrument Serif was the italic, not the regular, so the first preview had the italic and upright words swapped. Check the font's name table before you trust a filename.
Step 4: the animations
Every card shares one small set of keyframes, and the cards are timed against each other so the page plays top to bottom: the hero, the blue graph, the bars, the tiles and then the repos.
- The name rises in one line at a time, and a blue shine sweeps across Vashishta every few seconds. The shine is a gradient fill whose
gradientTransformis animated with SMIL, because a CSSbackground-clip: texttrick doesn't exist in SVG. - The ASCII portrait prints in, row by row, like a slow terminal. It's the same portrait as before, recoloured to ink, with each of its 96 rows fading in 18 ms after the one above.
- The bars grow up from the baseline (
transform-origin: bottomwithtransform-box: fill-box), then the best month's number pops in above its bar. - The blue graph pops in square by square, sweeping left to right.
- The tiles get the biggest entrance. Each one swings up from below, tilted, overshoots and settles. Its number counts up from zero, a ring pulses out of the corner and a shine sweeps across it every few seconds after. The count-up is 18 SMIL
<set>frames, one text element per value, each shown for a few milliseconds, because CSS can't change text. - The little arrows on the tiles nudge, and the dot next to "Fullstack engineer at Dock" pulses.
All of it switches off under prefers-reduced-motion.
Step 5: refreshed every morning
The repo already had a GitHub Action that scrapes my contribution calendar into data/contributions.json every day. The new script, render_readme_cards.py, reads that file and redraws every card: the total, the months, the streak, the busiest day and the graph. The Action runs it and commits the SVGs back.
- name: Render README cards (hero, tiles, activity, repos, blue graph)
  run: python scripts/render_readme_cards.py
To check the layout without waiting for animations, the script has a STATIC=1 mode that shows everything at its end state, which I screenshot in headless Chrome before pushing.

Build your own
Redesign my GitHub profile README (the USERNAME/USERNAME repo) as a stack of animated SVG cards. Read my current README and my website first and match its colours and fonts. Write one Python script that renders each card into cards/: a hero with my name, one line about me and an optional portrait; three linked tiles in a row (each an img at width 32.5%); a chart of my contributions per month with my streak, active days and busiest day; one card per featured repo; and my contribution graph in my brand colour.
The cards are shown through img tags, so use only what works there: an inline style block with CSS keyframes, SMIL animate elements, and fonts subset with pyftsubset and embedded as base64 WOFF data URIs. Stagger the delays so the page plays top to bottom, and turn every animation off under prefers-reduced-motion. Read contribution data from a JSON file a scheduled GitHub Action refreshes daily, and add a step to that Action that runs the script and commits the cards. Add a STATIC=1 mode that shows the final frame so I can screenshot it before pushing.